
Cloutflow OS · Module
Reporting
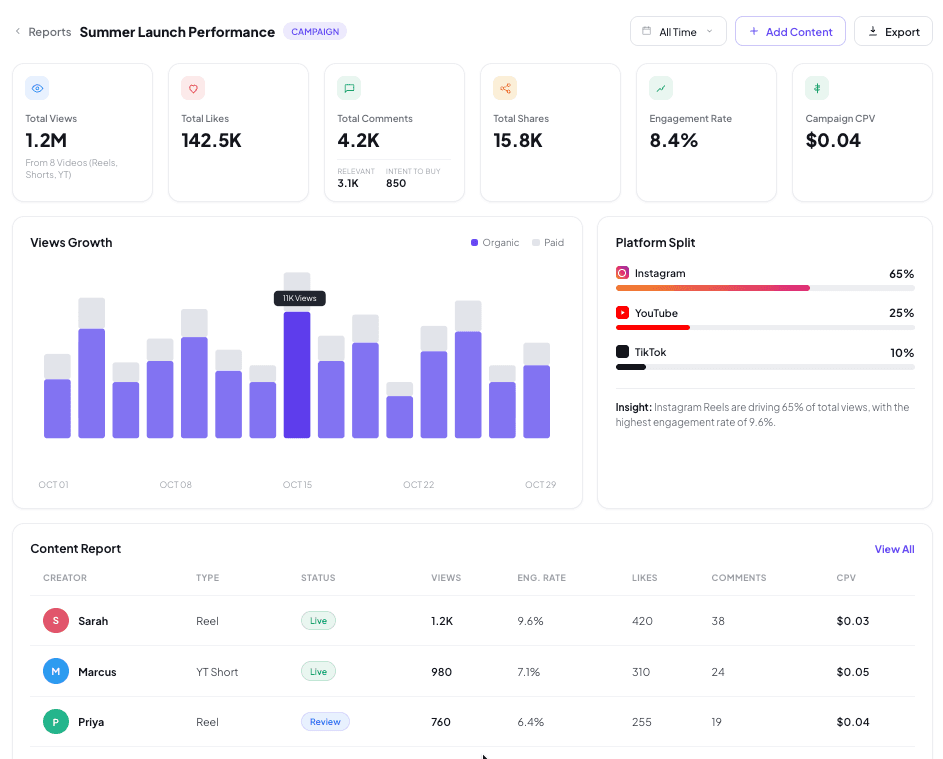
Live dashboards, not screenshot decks.
Live dashboards, creator-wise performance, sentiment tracking, campaign benchmarks, and final report generation that moves beyond Excel.
Reporting layer that converts live performance into stakeholder-ready narratives: dashboards, exports, and learning summaries without manual screenshot decks.
- Capabilities
- 5 core functions
- Workflow
- 3 stages
- Inputs
- 3 data sources
- Outputs
- 3 artifacts
Execution workflow
How Reporting runs inside the OS
Stage-by-stage flow from ingestion through review, with explicit inputs and outputs at each handoff.
Build live views
Auto-generate dashboards per campaign and creator with consistent metrics and filters.
Package for stakeholders
Export summaries, tables, and executive takeaways; keep provenance for every number.
Post-campaign learning loop
Capture what worked (formats, creators, hooks) and feed it into next brief + discovery.
Core capabilities
What teams use inside Reporting
- 01
Live dashboards
Auto-updating campaign and creator views without manual exports.
- 02
Creator-wise performance
Per-creator deliverable status, metrics, and efficiency in one table.
- 03
Sentiment tracking
Rolling comment tone and theme summaries for stakeholder updates.
- 04
Campaign benchmarks
Side-by-side vs plan and vs category norms.
- 05
Final report generation
Executive summaries and export packs with metric provenance.
System contract
Inputs, outputs, and integration points
Data the module consumes from upstream workflows and artifacts it produces for downstream planning, execution, and reporting.
Inputs
- Normalized performance metrics
- Campaign metadata and objectives
- Creator roster + deliverables
Outputs
- Stakeholder dashboards
- Exportable report packs
- Learnings + recommendations for iteration